Case study — Sonshine Glass & Mirror
That's not just more time passing — normalized to a daily rate, it's roughly a 500x increase. A real Orange County client, pulled straight from their own Google Search Console. No cherry-picking, no rounding in our favor.
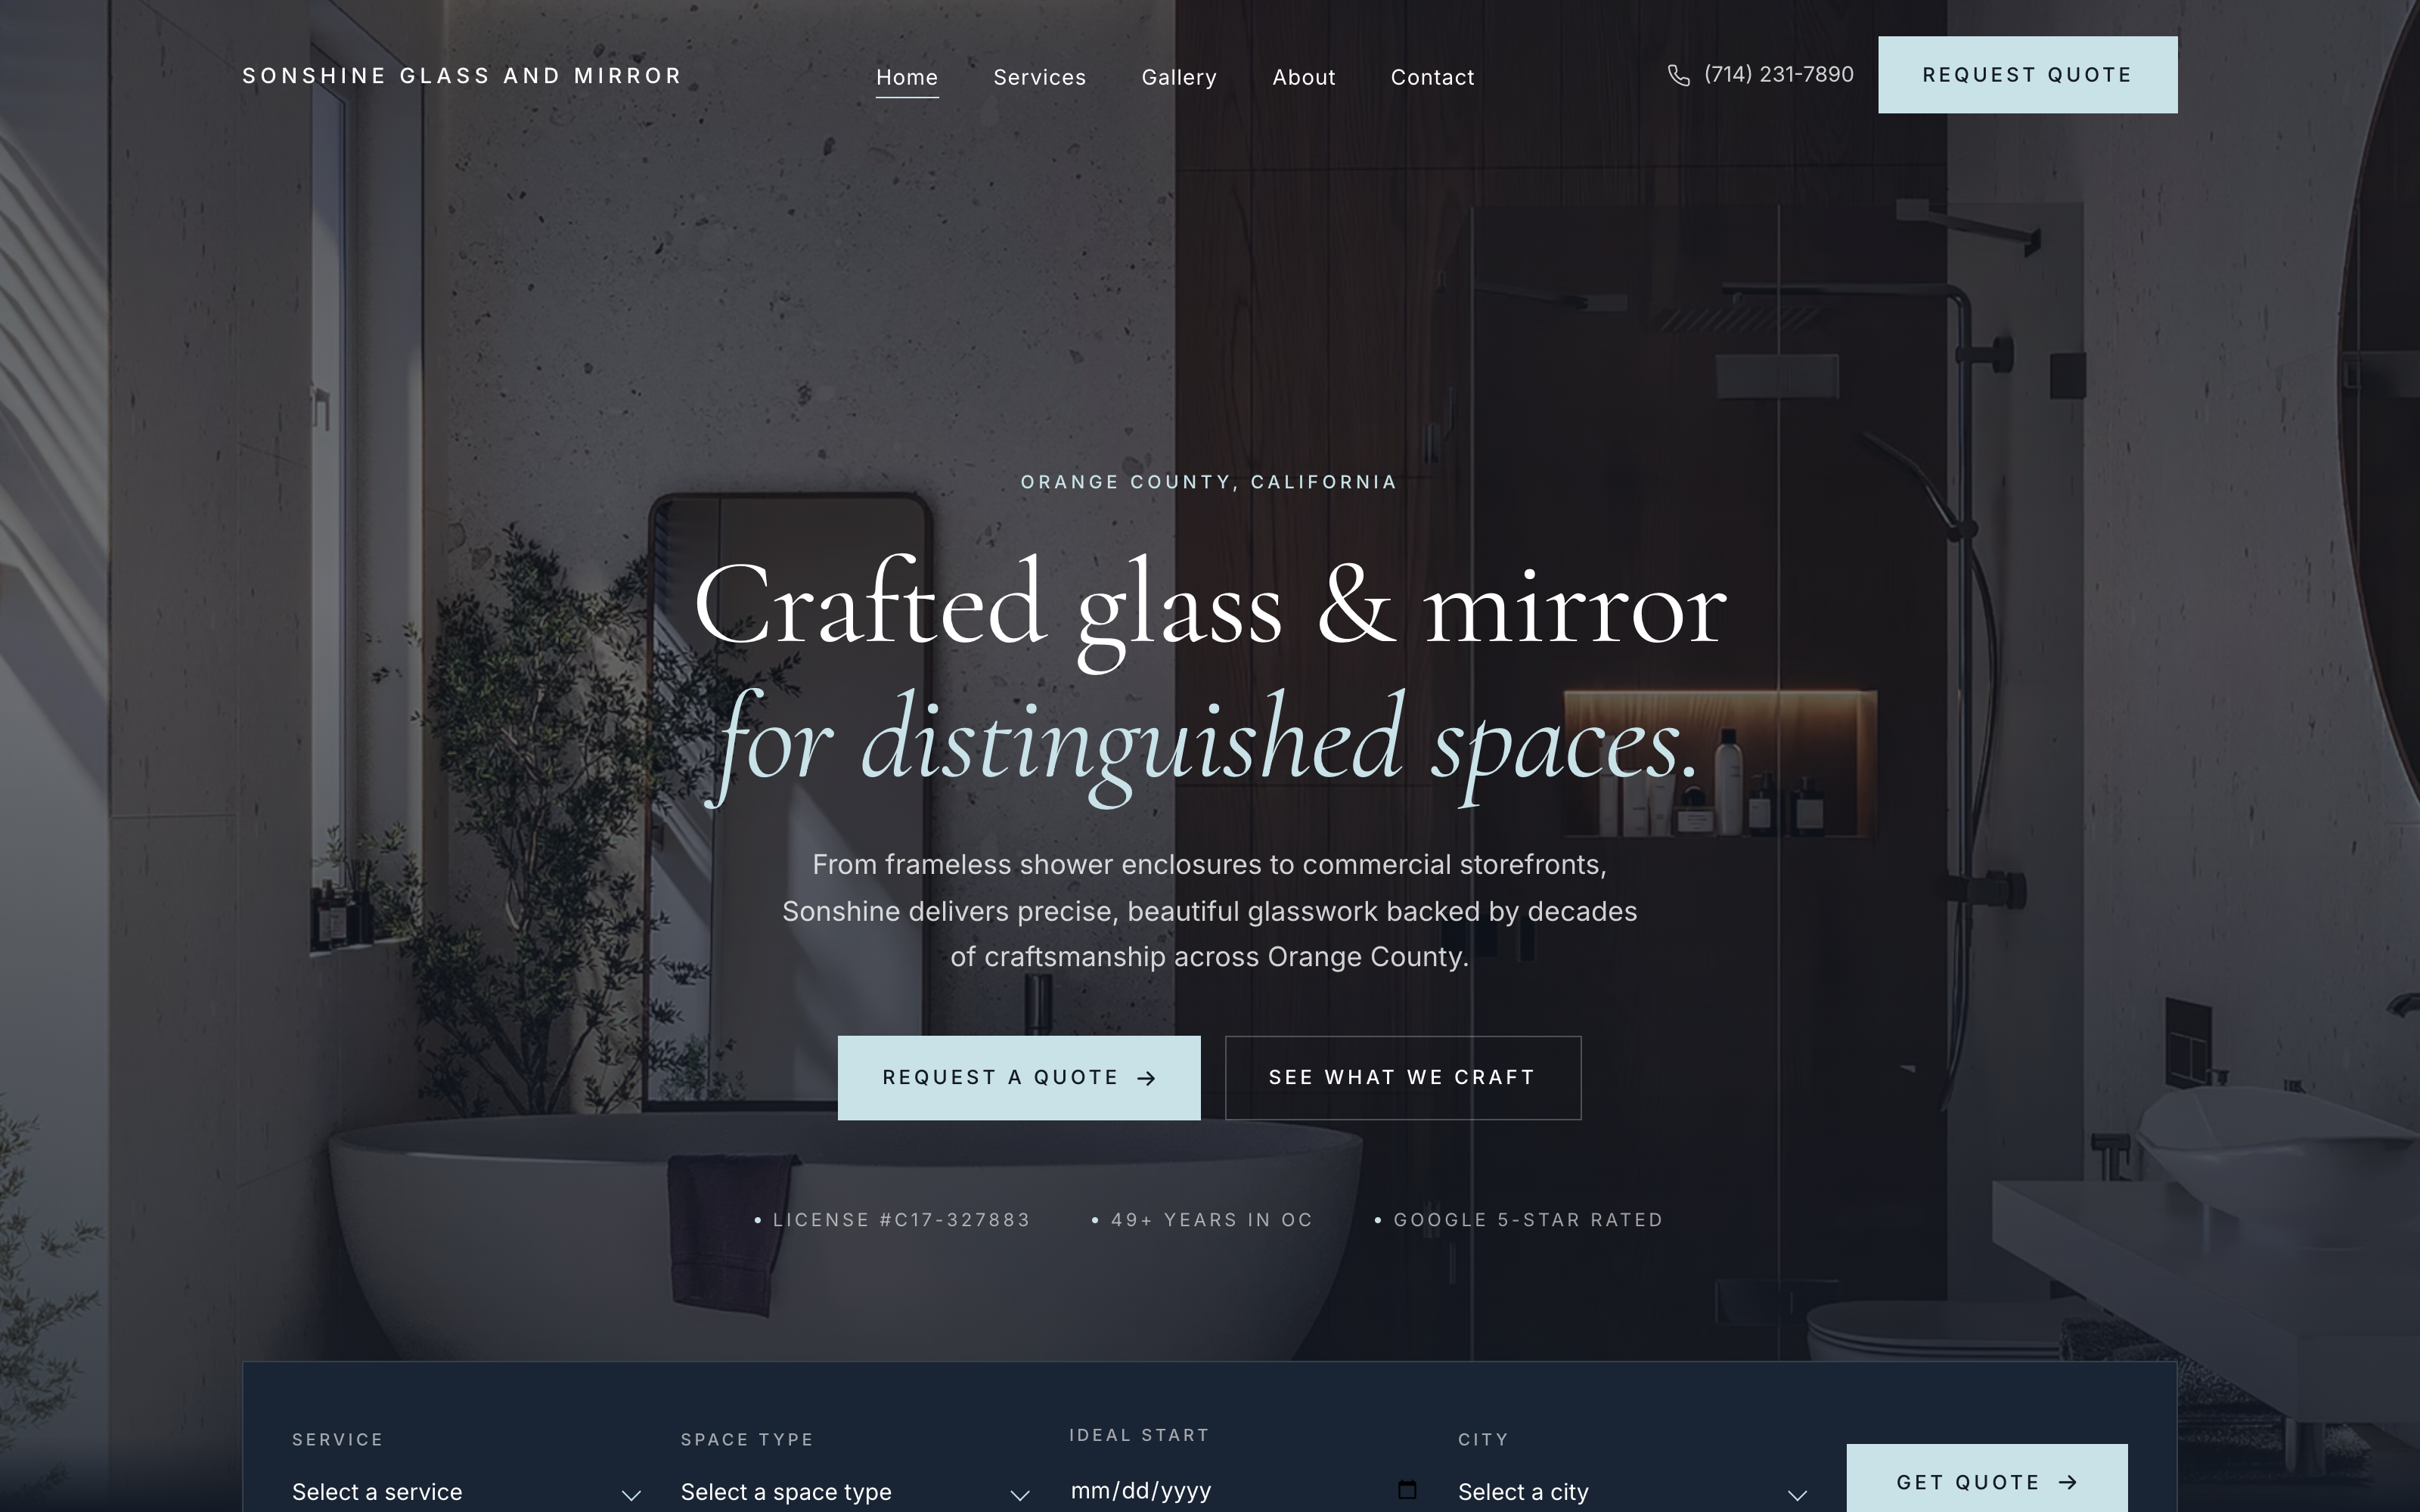
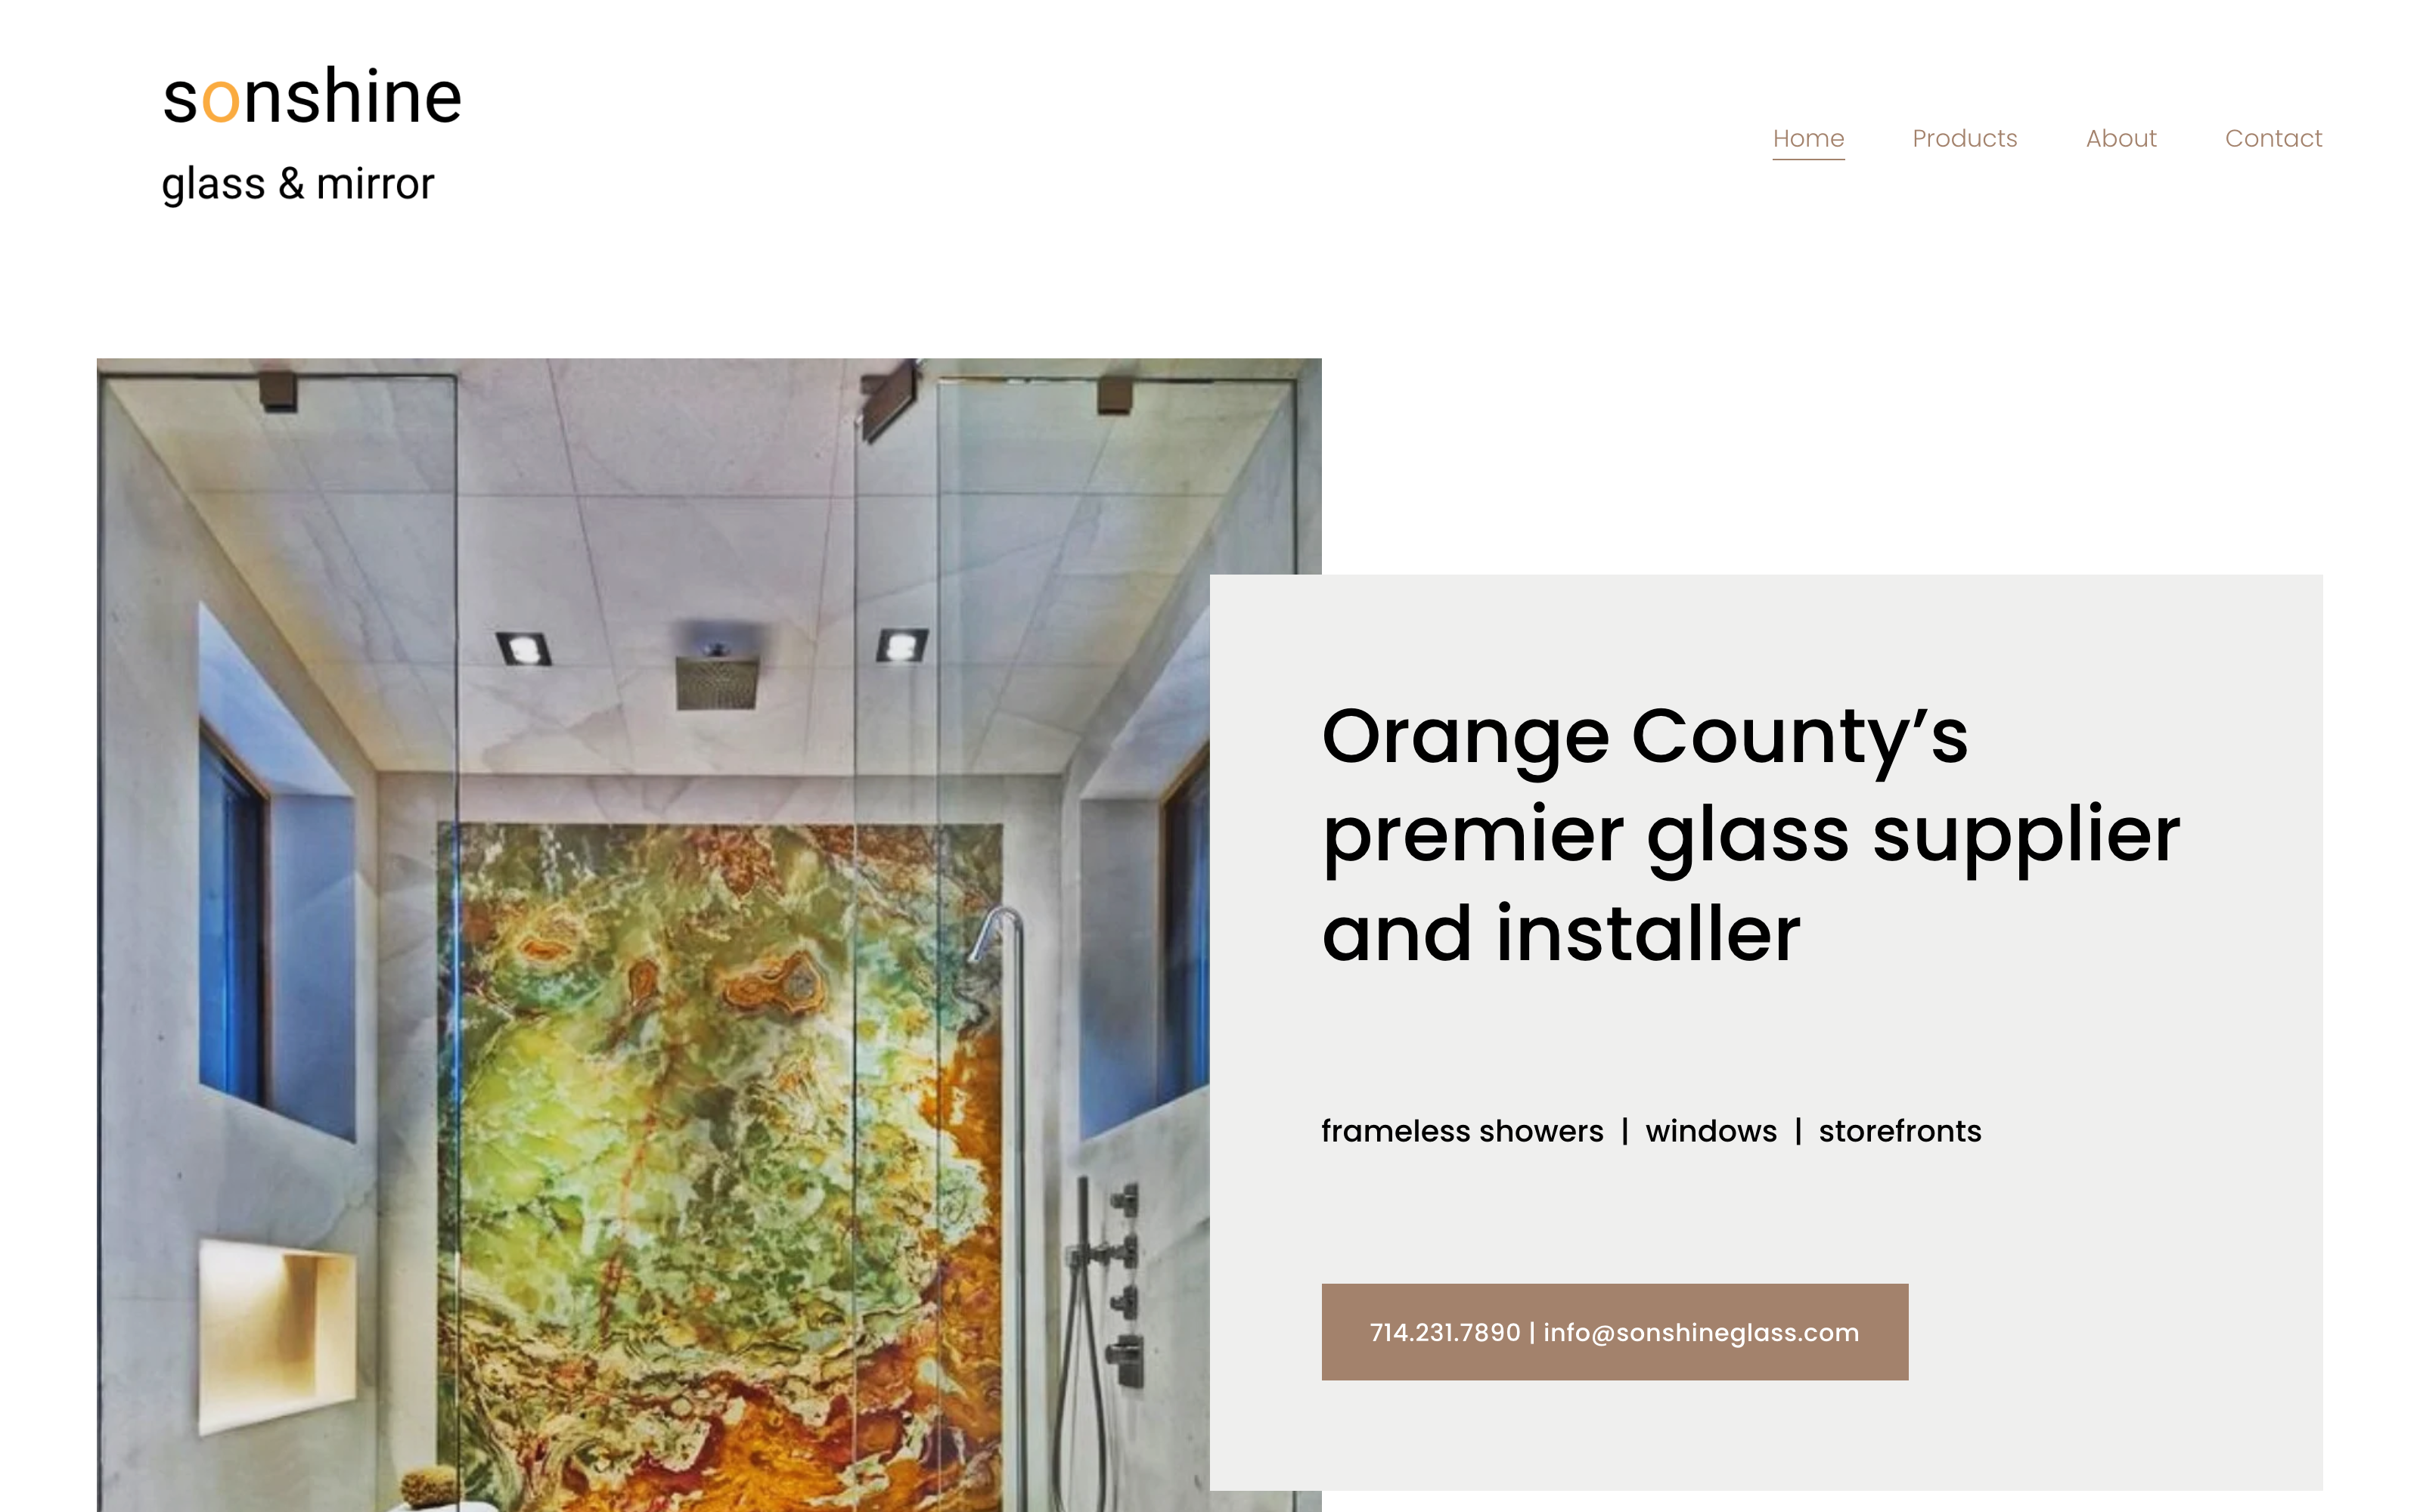
Old site vs. new site
Both screenshots are the real sonshineglass.com homepage — just five years apart. Nothing else about the business changed.
Before the rebuild: generic template, stock layout.
After the C5 rebuild: real photography, real content, a real quote flow.
What Google Search Console shows
Google Search Console only retains about 16 months of history, so the "before" period below is effectively everything available prior to the rebuild — March 21, 2025 through May 26, 2026. The rebuild went live May 27, 2026. That means the "after" period is under two months, compared against a "before" period nearly 8x longer.
| Before 3/21/25 – 5/26/26 · 431 days | After 5/27/26 – 7/21/26 · 55 days | |
|---|---|---|
| Total impressions (site-wide) | 111 | 6,630 |
| Average CTR | 0.9% | 1.2% |
| Homepage clicks / impressions | 1 / 55 | 69 / 3,926 |
Worth noting: this is organic web search only — it doesn't include Google Business Profile calls, direction requests, or local-pack map clicks, which for a local trade business often account for more real leads than website clicks alone. It's also early; organic search typically compounds over 4–6+ months, not two. The $300K+ in lead volume referenced elsewhere on this site reflects all channels, not just this one.
Normalized for time
Comparing 79 clicks against 1 click means little on its own if one period is 4x longer than the other — a longer window naturally accumulates more, regardless of what changed. So we normalized both periods to a daily rate instead.
| Before (per day) | After (per day) | Multiplier | |
|---|---|---|---|
| Impressions | 0.26 | 120.5 | ~468x |
| Clicks | 0.002 | 1.44 | ~618x |
Normalizing actually makes the result look bigger, not smaller — the old site was producing almost nothing even averaged across 14+ months, while the new one is generating clicks and impressions at roughly 500–600x that daily rate in under eight weeks. That's not an artifact of the longer comparison window; it's the opposite of one.
For scale only, not a projection or a promise: holding the new rate for the same 431 days the "before" period covers would work out to roughly 52,000 impressions and 620 clicks, against the old site's actual 111 and 1. We're not claiming that will happen — just showing what the current rate means at equal scale.
What actually changed
The visual refresh is the part you can see in the screenshots above, but it's not what moved these numbers on its own. The bigger shift was underneath: real, individual content pages replacing a handful of generic ones, a site Google could actually crawl and index properly, and a mobile experience that held up — mobile clicks went from effectively zero to a real share of total traffic, right alongside desktop. Search interest in the business's own name went from nonexistent to real and repeatable, which only happens once a brand has enough of a footprint for people to search for it by name instead of finding it by accident.
This is the same client behind the $300K+ in lead volume referenced elsewhere on this site — the visibility shown here is the mechanism behind that number, not a separate story.
The paid diagnostic reviews your real search visibility, your Google Business Profile, and your phones — then hands you a page-by-page strategy for what to fix first.